05. Counting Missing Data
Counting Missing Data
One interesting way we can apply bar charts is through the visualization of missing data. We can use pandas functions to create a table with the number of missing values in each column.
df.isna().sum()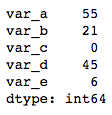
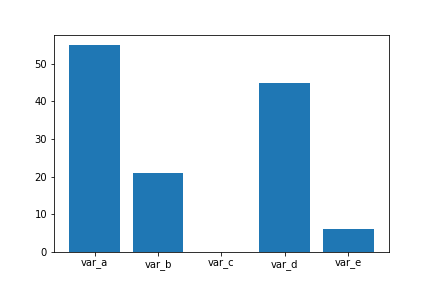
What if we want to visualize these missing value counts? We could treat the variable names as levels of a categorical variable, and create a resulting bar plot. However, since the data is not in its tidy, unsummarized form, we need to make use of a different plotting function. Seaborn's
barplot
function is built to depict a summary of one quantitative variable against levels of a second, qualitative variable, but can be used here.
na_counts = df.isna().sum()
base_color = sb.color_palette()[0]
sb.barplot(na_counts.index.values, na_counts, color = base_color)
The first argument to the function contains the x-values (column names), the second argument the y-values (our counts).
As a general note, this is a useful function to keep in mind if your data is summarized and you still want to build a bar chart. If your data is not yet summarized, however, just use the
countplot
function so that you don't need to do extra summarization work. In addition, you'll see what
barplot
's main purpose is in the next lesson, when we discuss adaptations of univariate plots for plotting bivariate data.